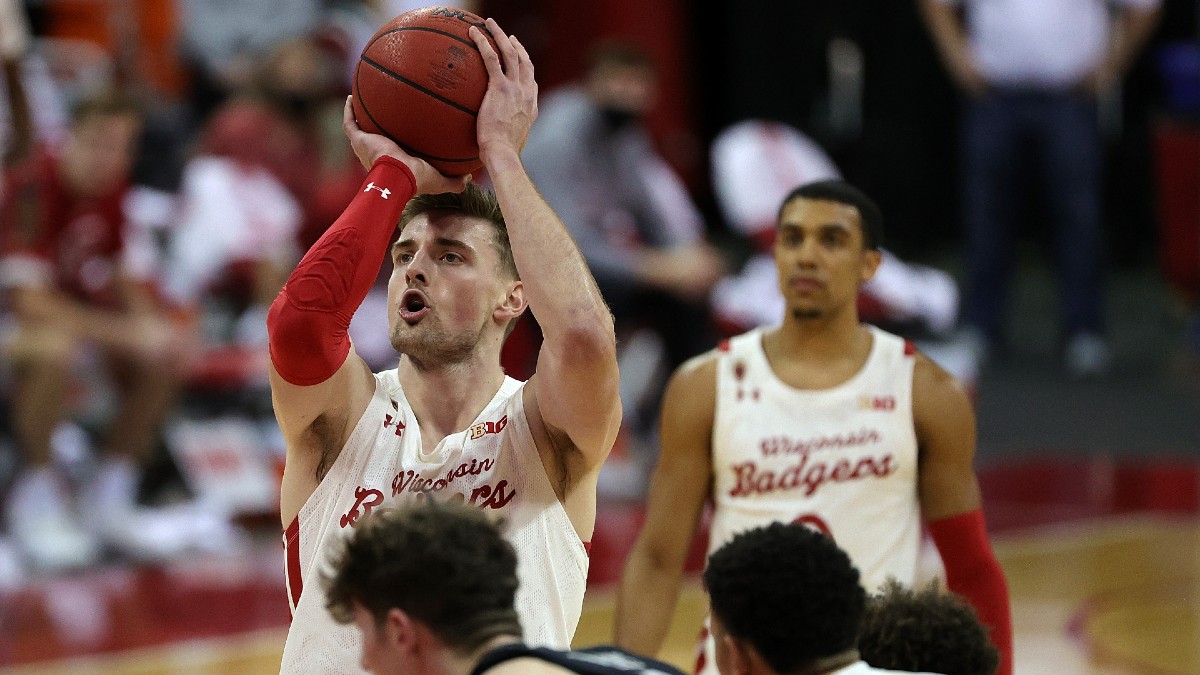
Stacy Revere/Getty Images. Pictured: Wisconsin’s Micah Potter shoots a free throw.
Seven years ago, An SB Nation article from an author named simply Eddie (no last name) filled out an entire 2014 NCAA Tournament bracket based solely on free-throw percentages.
Eddie’s process was as such:
- If two teams were separated by five seeds or fewer, Eddie picked whichever team had the better free-throw percentage, straight up.
- If two teams were separated by six to 10 seeds, there would need to be a five-percent difference in free-throw shooting percentage for Eddie to pick the higher seed.
- If two teams were separated by 11 to 15 seeds, there would need to be a 10-percent difference in free throw shooting percentage for Eddie to pick the higher seed.
![]()
![]()
![]()
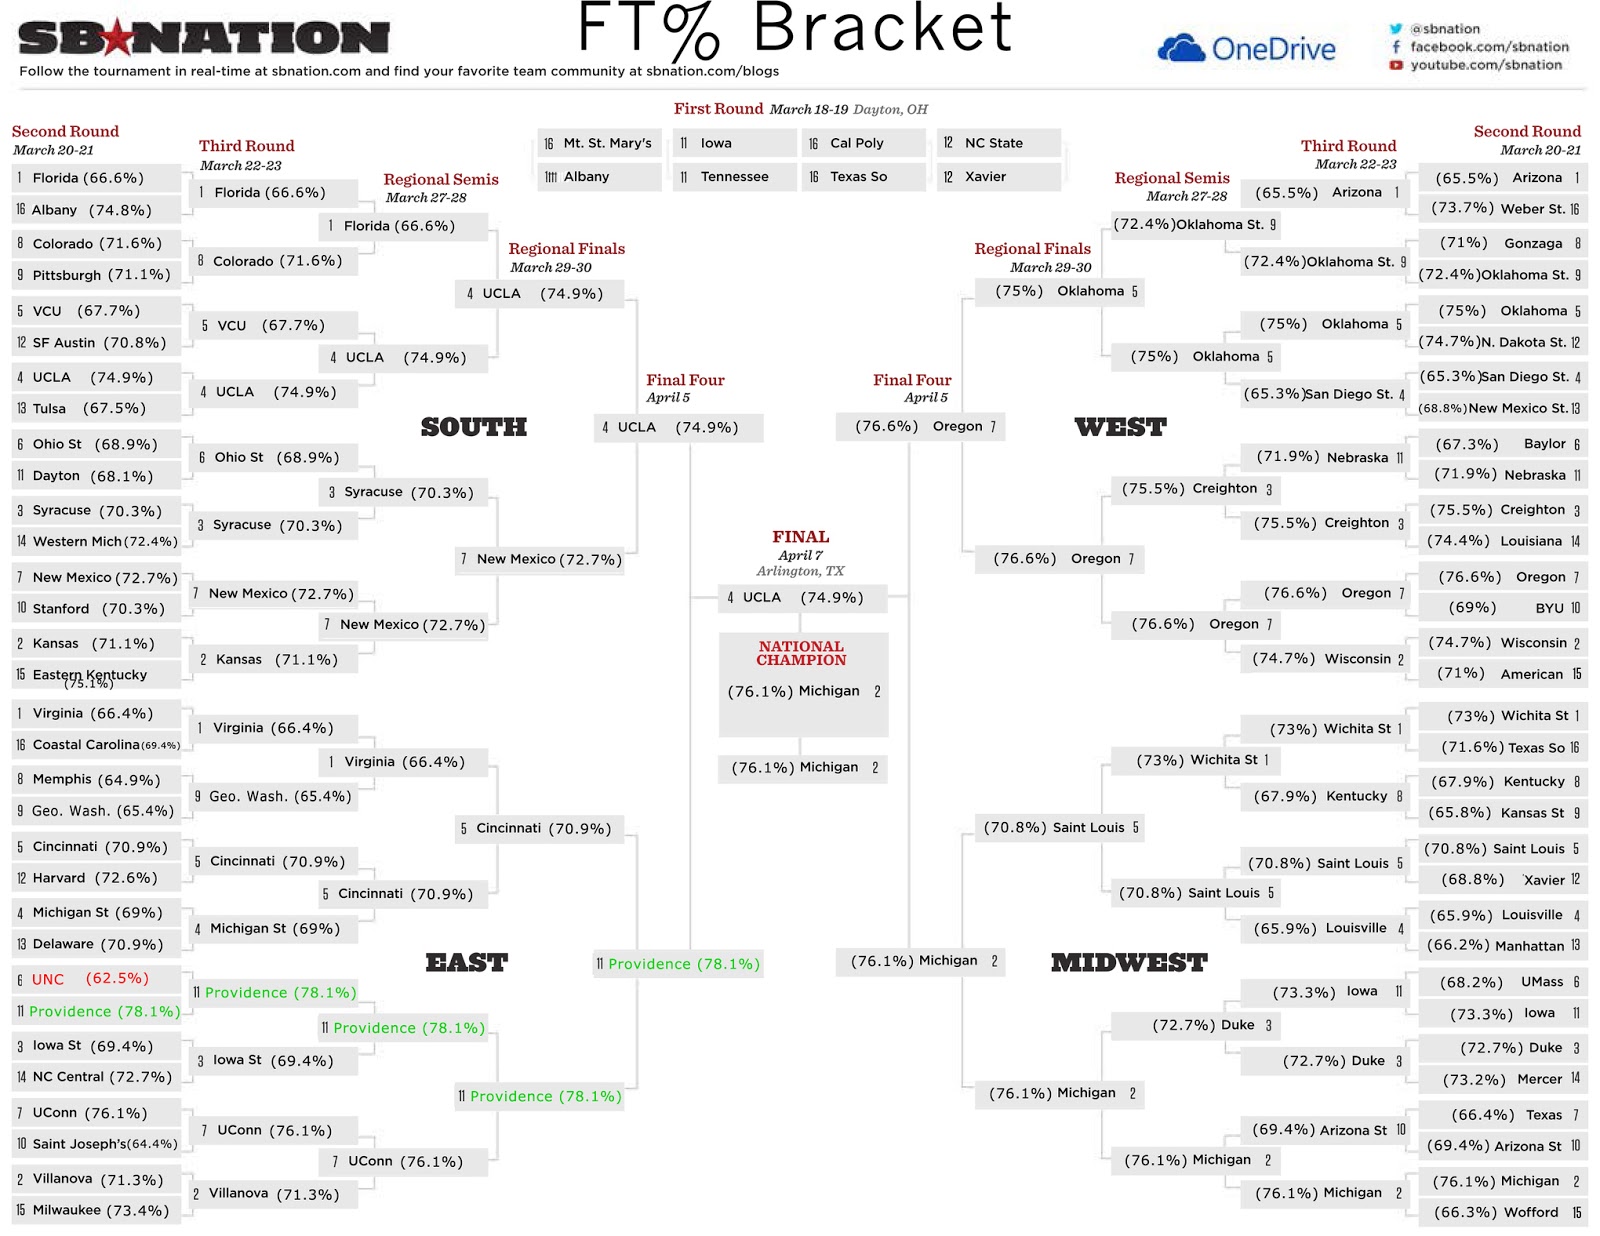
Photo Credit: https://www.sbnation.com/college-basketball/2014/3/18/5518688/ncaa-bracket-predictions-2014-free-throws
In short, not awful. Eddie picked 19 of the first 32 games correctly, and then got 10 of the Sweet 16 teams through.
After that, it fell off a cliff. Only one of Eddie’s teams made it to the Elite Eight: Michigan, which proceeded to lose to Kentucky. So, Eddie went 0-for-4 in the Final Four.
However, Eddie left us with a kind note at the end of the article:
“But, if you want to make some money, this can be a helpful tool when it comes to betting against the spread.”
I wanted to dig into that notion and see if there’s some sort of positive correlation — not necessarily causation — between better free-throw shooting teams and ATS results.
_BookPromo=1264
Better FT% Teams ATS in the 2014 Round of 64
To pick teams against the spread (ATS) based only on which team had a better free-throw percentage (FT%), I decided we could disregard Eddie’s rules. Using point spreads means we don’t need any percentage differences between any two teams, regardless of seed.
Additionally, I will keep my analysis to just the Round of 64 for this thought experiment. As Eddie’s system falls apart after the Round of 64, so does ours.
Finally, I pulled the ATS results of the 2014 Round of 64 from our Sports Insights database. Which, by the way, is an amazing tool to help look at historical betting trends across college basketball or any other sport.
By picking the team with just the better FT% going into the matchup — regardless of FT volume — you would have gone 19-11-2 ATS in the 2014 Round of 64. Assuming average odds of -110 and units of $110, you would have netted $690 for a ROI of 21.6%.
That’s a remarkable record for a system you would expect to be no better than a coin flip.
However, just one Round of 64 from one NCAA Tournament isn’t enough to prove a trend. Therefore, I wanted to examine every Round of 64 since the 2014 NCAA Tournament and see what results we can find.
_BookPromo=1217
Sports Insights Data and Results
Per KenPom, the average FT% across all Division-I teams since the 2013-14 season is 70.4%. That will be our baseline for this analysis.
I concluded the best way to find a longer-term FT shooting trend is by analyzing how teams that shoot above-average from the charity stripe perform ATS vs. teams that shoot below-average.
In the Round of 64 since the 2014 NCAA Tournament, teams that shoot 70.4% or better from the FT line are 44-35-1 ATS against teams who shoot 70.3% or worse from the FT line. That’s a ROI of 7.3% for a slightly larger sample size, and it’s worth taking a closer look at.
This system itself is still a little volatile for my liking. So I thought I would increase the difference in FT% between the better- and worse-shooting teams.
So, I upped the minimum FT% for the above-average shooting team 2.5-percentage points to 72.9%. Then, I lowered the maximum FT% for the below-average shooting team 2.5-percentage points to 67.8%. The result was a smaller sample size, but with slightly better results:
Finally, I upped the minimum FT% for the above-average shooting team to 75% and lowered the maximum FT% for the below-average shooting team to 65%. That situation has only occurred six times in the past six Round of 64’s:

2021 NCAA Tournament by FT%
What are we to make of this information?
Clearly, there is an argument to be made for betting on teams that are significantly better at shooting free throws than its opponent, specifically in the Round of 64.
Intuitively, this seems accurate. Not only is FT shooting often an indicator of a more-talented team, sree throws at the end of games are often the difference between Illinois covering as six-point favorites or Texas Southern sneaking inside as a 24-point underdog.
Here is the 2021 NCAA Tournament first round with each team’s FT% and spread on DraftKings (with the exception of games that are affected by the First Four games).
Given the matchups and the Sports Insights systems I built, there are four Round of 64 games I’d be willing to play based on FT% alone:
#10 Rutgers (63.2%) VS. #7 Clemson (76.5%) +1.5
- Total +13.3% difference. Rutgers falls below 65%, while Clemson above 75%.
#12 UCSB (76.3%) +7 VS. #5 Creighton (64.2%)
- Total +12.1% difference. Creighton falls below 65%, while UCSB above 75%.
#9 Wisconsin (76.7%) +1.5 VS. #8 North Carolina (66.8%)
-
- Total +9.9% difference. North Carolina falls below 67.8%, while Wisconsin above 72.9% (and 75%).
#15 Cleveland St. (66.9%) VS #2 Houston (74.3%) -20.5
-
- Total +6.4% difference. Cleveland St. below 67.8%, while Houston above 72.9%.
![]()
![]()
![]()