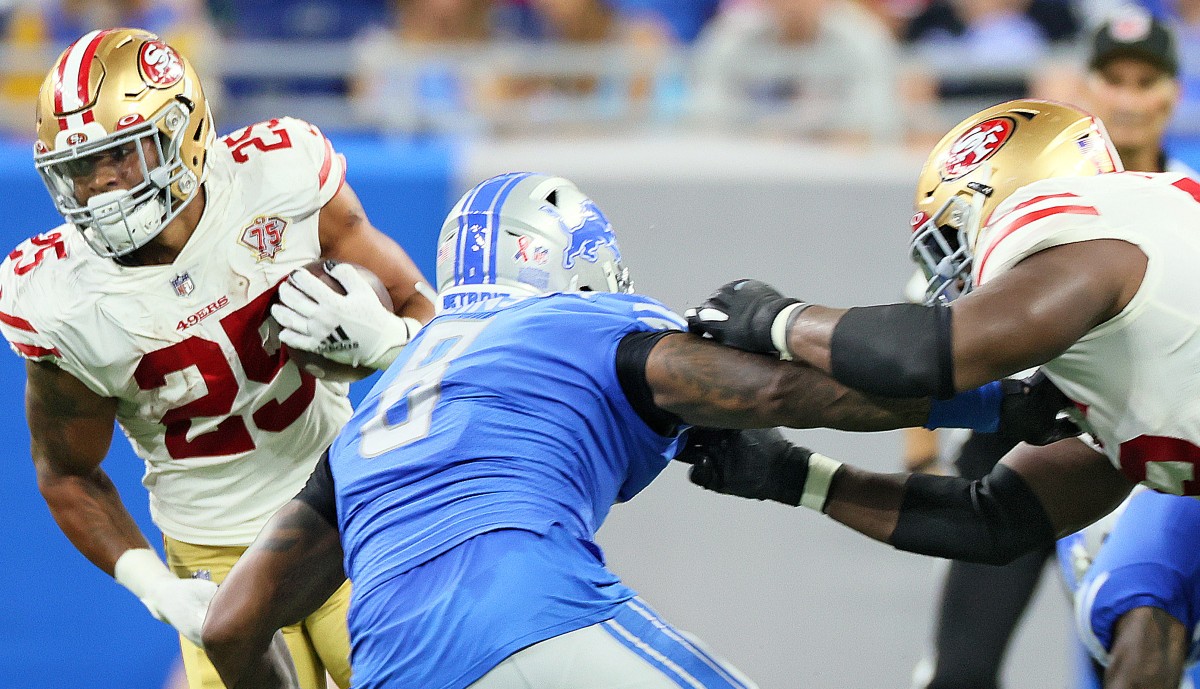
Credit: Nur Photo, Getty. 49ers running back Elijah Mitchell
Table of Contents
- Adjusted Line Yards Definition
- Adjusted Line Yards Examples and Statistics
- Can Adjusted Line Yards Help Me With Betting?
_PromoID=[3995, 5577]
Adjusted Line Yards Definition
Adjusted Line Yards is a metric that aims to separate and define how the offensive line plays a role in rushing yards separate from the running back. Football Outsiders does a great job of defining the stat here, but I’ll try to concisely summarize their explanation.
ALY are broken up into four categories, all with different weight being put on the offensive line. They are as follows:
- Runs for a loss: 120% strength
- 0-4 yard runs: 100% strength
- 5-10 yards: 50% strength
- 11+ yards: 0% strength
Of course, much like any other stat there are outlying factors that can’t be accounted for. We don’t know the formation that the plays were run in, we don’t know which offensive lineman may have contributed more on a given play and we don’t know the context for the play.
These are all important considerations, but you can’t make a perfect metric, and it’s also why we generally have so many stats.
Adjusted Line Yards Examples and Statistics
To try and outline the method of the stat better, here is a hypothetical chart that derives the adjusted line yards of certain play scenarios.
| Play Result | Adjusted Line Yards |
|---|---|
| -3 yards | -3.6 yards |
| -1 yards | -1.2 yards |
| 0 yards | 0 yards |
| 3 yards | 3 yards |
| 7 yards | 5.5 yards |
| 12 yards | 7 yards |
| Total | 10.7 yards / 6 plays |
In plays that range from 5-10 yards, the first four yards are weighted at 100% while the remaining ones prior to 10 yards are weighted at 50%. In plays with 11+ yards, you don’t have to calculate the yardage beyond there, with the idea being that the running back is accountable for those yards.
The league leaders and those who struggled the most in adjusted line yards from the NFL in 2020 are below.
| Team (League Rank) | Adjusted Line Yards |
|---|---|
| Minnesota Vikings (1) | 5.07 |
| Tennessee Titans (2) | 4.97 |
| New England Patriots (3) | 4.94 |
| New Orleans Saints (4) | 4.89 |
| Green Bay Packers (5) | 4.85 |
| Denver Broncos (28) | 4.02 |
| LA Chargers (29) | 4.00 |
| Arizona Cardinals (30) | 3.91 |
| Cincinnati Bengals (31) | 3.88 |
| Pittsburgh Steelers (32) | 3.78 |
In this context, a yard is a massive difference, and it can help explain why running backs like Dalvin Cook or Derrick Henry can have massive success at times. Of course, it won’t be the only reasons, but it adds a bit of context to the picture.
Can Adjusted Line Yards Help Me With Betting?
This is a metric that could be of serious use to fantasy bettors of all shapes and forms. If you have a roster decision to make and a team’s starting running back may be out, adjusted line yards can help you decide which transition will be more seamless than another. Which player will have a similar impact to the starter, and who will be in a worse position?
While not a perfect comparison due to external factors, as I talked about above, here are the same teams in adjusted line yards and how their feature back scored in fantasy this past season with standard scoring.
| Team (Player) | Adjusted Line Yards | Fantasy Output Per Game |
|---|---|---|
| Minnesota Vikings (Dalvin Cook) | 5.07 | 21 |
| Tennessee Titans (Derrick Henry) | 4.97 | 19.6 |
| New England Patriots (Damien Harris) | 4.94 | 8.6 |
| New Orleans Saints (Alvin Kamara) | 4.89 | 19.7 |
| Green Bay Packers (Aaron Jones) | 4.85 | 15.1 |
| Denver Broncos (Melvin Gordon) | 4.02 | 11.1 |
| LA Chargers (Austin Ekeler) | 4.00 | 11.1 |
| Arizona Cardinals (Kenyan Drake) | 3.91 | 11.2 |
| Cincinnati Bengals (Giovani Bernard) | 3.88 | 6.9 |
| Pittsburgh Steelers (James Conner) | 3.78 | 10 |
Due to the rampant natures of injuries within the sport, this metric can be one that is vital in your toolbox when you have to make a decision on running backs, or in numerous betting scenarios.