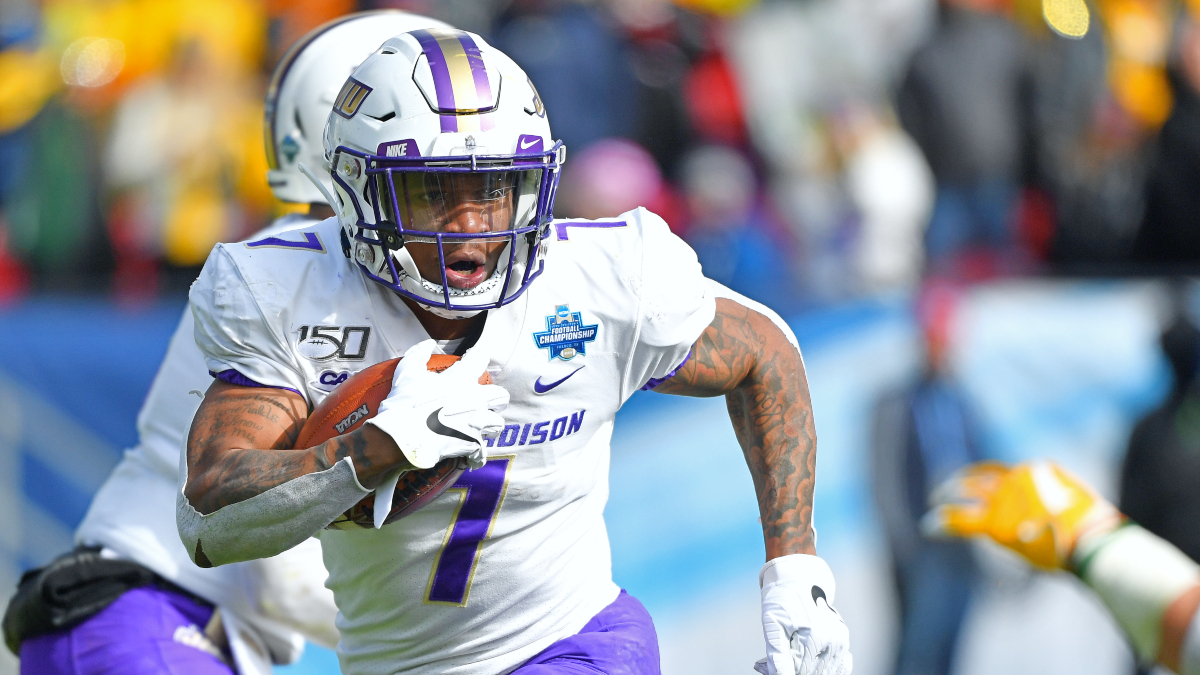
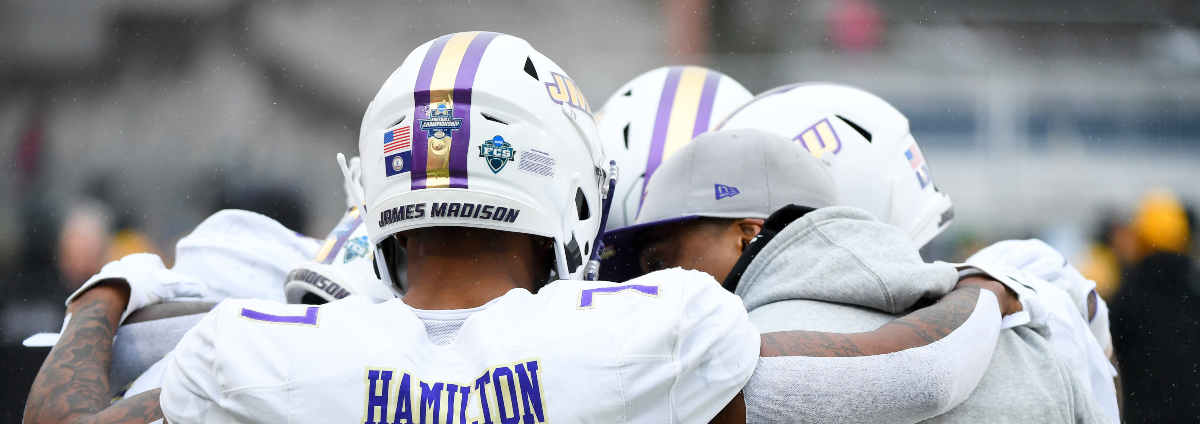
Jamie Schwaberow/NCAA Photos via Getty Images. Pictured: Jawon Hamilton #7 of the James Madison Dukes football team.
We’re down to eight teams left in the FCS Playoffs after last weekend.
The second round will feature matchups of North Dakota State vs. Sam Houston State, Delaware vs. Jacksonville State, North Dakota vs. James Madison, and Southern Illinois vs. South Dakota State.
I’ll break down each game here and try to provide some actionable betting angles. Make sure to check out our individual game previews for a more in-depth look at each matchup.
![]()
![]()
![]()
FCS Playoffs Quarterfinals Odds & Picks
| Click on a game to skip ahead | |
| North Dakota State vs. Sam Houston State | 3 p.m. ET |
| Delaware vs. Jacksonville State | 3 p.m. ET |
| North Dakota vs. James Madison | 6 p.m. ET |
| Southern Illinois vs. South Dakota State | 9 p.m. ET |
All listed odds have been updated as of early Sunday morning via BetMGM. Photos via Getty Images.
Always shop for the best price using our NCAAF Odds page, which automatically surfaces the best lines for every game.
North Dakota State vs. Sam Houston State
 |
|
| North Dakota State Odds | -2.5 |
| Sam Houston State Odds | +2.5 |
| Moneyline | -135 / +115 |
| Over/Under | 47.5 |
| Time | TV | Sunday, 3 p.m. ET | ESPN |
| Odds via BetMGM. | Bet Now |
Click here to view offensive and defensive team stats for this matchup.
2021 FCS Spring Rankings
North Dakota State (NDSU) Offense vs. Sam Houston State (SHSU) Defense
| Team Stat | NDSU Offense | SHSU Defense | Advantage |
| Points per Game | 41 | 11 | SHSU |
| Plays per Game | 87 | 88 | Draw |
| Yards per Play | 10 | 24 | NDSU |
| Points per Play | 86 | 6 | SHSU |
| First-Down Rate | 56 | 30 | SHSU |
| Red-Zone Scoring Rate | 11 | 22 | NDSU |
| Pass Completion % | 41 | 38 | Draw |
| Yards per Pass | 45 | 42 | Draw |
| INT Rate | 80 | 87 | NDSU |
| Yards per Rush | 12 | 4 | SHSU |
| Havoc | 13 | 4 | SHSU |
Sam Houston State (SHSU) Offense vs. North Dakota State (NDSU) Defense
| Team Stat | SHSU Offense | NDSU Defense | Advantage |
| Points per Game | 3 | 17 | SHSU |
| Plays per Game | 17 | 17 | Draw |
| Yards per Play | 27 | 31 | Draw |
| Points per Play | 56 | 19 | NDSU |
| First-Down Rate | 95 | 29 | NDSU |
| Red-Zone Scoring Rate | 81 | 91 | SHSU |
| Pass Completion % | 25 | 36 | SHSU |
| Yards per Pass | 65 | 40 | NDSU |
| INT Rate | 8 | 76 | SHSU |
| Yards per Rush | 16 | 37 | SHSU |
| Havoc | 41 | 43 | Draw |

![]()
![]()
![]()
I thought North Dakota State was overvalued last week. NDSU disagreed.
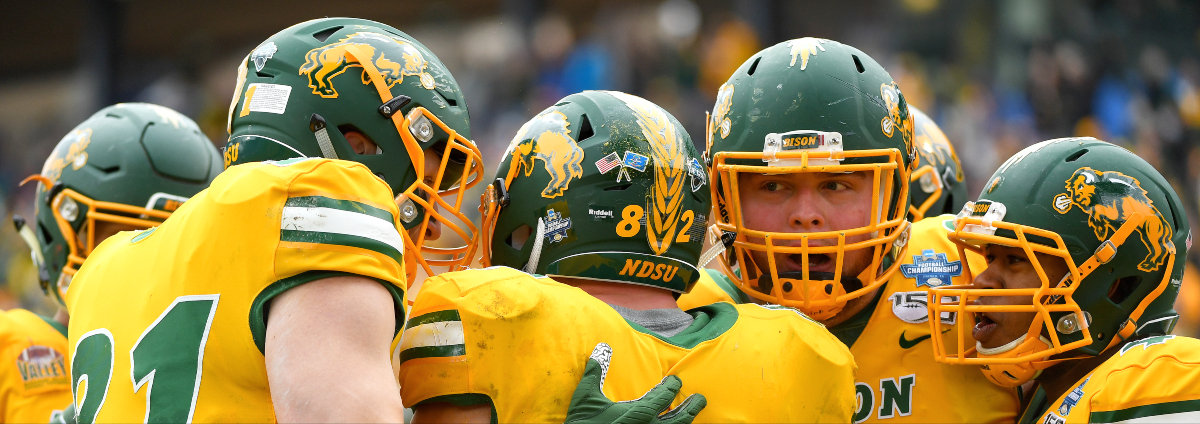
After a comfortable win against Eastern Washington, the Bison will face one of the top teams in FCS, Sam Houston State. The Bearkats finished the regular season with an average point differential of 27.3, good for second in the nation.
The offense has been the main reason for Sam Houston’s dominance. Quarterback Eric Schmid ranks first in the nation in yards per attempt, and the offense as a whole ranks first in yards per play.
Last week’s performance against Monmouth showed some cause for concern, however.
Despite ranking 17th in plays per game entering last weekend, Sam Houston State managed to run only 42 plays in the game, compared to Monmouth’s 92. Two interceptions combined with a 4-for-13 performance on third down probably played a pretty big influence in that.
Even though the time of possession was lopsided, Sam Houston was still the more efficient team on a per-play basis. The offense generated 5.2 yards per play to Monmouth’s 4.3, which was why the Bearkats could escape with a win. The defense also held Monmouth to 2.2 yards per carry, which could be a key factor in this matchup with NDSU.

![]()
![]()
![]()
The performance against Monmouth was no different than what the Bearkat defense did all year long. The front ranked fourth in yards per carry allowed and 14th in tackle for loss rate. As a whole, it was top-10 in both points per play and touchdown rate.
The reason Sam Houston’s run defense is such a key factor here is because NDSU leans heavily on the run game. The Bison rank 88th out of 97 teams in pass rate. They are also efficient running the football, with the 12th-ranked rushing attack in terms of efficiency.
As a whole, the Bison offense has been underwhelming thanks to a disappointing passing attack. NDSU is 50th in yards per pass attempt and 80th in interception rate.
The offense ranks only 31st in yards per play. However, it exploded last week against Eastern Washington with 42 points on 6.9 yards per play. This could be because the offense is finally clicking with more time to gel, or it could just be a meaningless one-game sample.
North Dakota State’s defense has been underwhelming to a degree this year as well.
It ranks 18th in points per game allowed but 45th in First Down Rate Allowed and has allowed opponents to score on 100% of red-zone trips. It could also be vulnerable against Sam Houston’s potent passing game, with a defense that ranks 40th in yards per pass attempt.
Pick: Sam Houston State ML +125 or better
»» Return to the Table of Contents ««
Delaware vs. Jacksonville State
 |
|
| Delaware Odds | +3.5 |
| Jacksonville State Odds | -3.5 |
| Moneyline | +135 / -160 |
| Over/Under | 41.5 |
| Time | TV | Sunday, 3 p.m. ET | ESPN3 |
| Odds via BetMGM. | Bet Now |
Click here to view offensive and defensive team stats for this matchup.
2021 FCS Spring Rankings
Delaware (UD) Offense vs. Jacksonville State (JSU) Defense
| Team Stat | UD Offense | JSU Defense | Advantage |
| Points per Game | 16 | 15 | Draw |
| Plays per Game | 41 | 32 | JSU |
| Yards per Play | 43 | 12 | JSU |
| Points per Play | 40 | 13 | JSU |
| First-Down Rate | 82 | 32 | JSU |
| Red-Zone Scoring Rate | 56 | 18 | JSU |
| Pass Completion % | 59 | 21 | JSU |
| Yards per Pass | 50 | 13 | JSU |
| INT Rate | 47 | 56 | UD |
| Yards per Rush | 29 | 10 | JSU |
| Havoc | 60 | 48 | JSU |
Jacksonville State (JSU) Offense vs. Delaware (UD) Defense
| Team Stat | JSU Offense | UD Defense | Advantage |
| Points per Game | 28 | 3 | UD |
| Plays per Game | 44 | 4 | UD |
| Yards per Play | 2 | 6 | Draw |
| Points per Play | 95 | 5 | UD |
| First-Down Rate | 70 | 8 | UD |
| Red-Zone Scoring Rate | 54 | 50 | Draw |
| Pass Completion % | 12 | 2 | UD |
| Yards per Pass | 67 | 1 | UD |
| INT Rate | 50 | 5 | UD |
| Yards per Rush | 24 | 26 | Draw |
| Havoc | 36 | 59 | JSU |
![]()
![]()
![]()
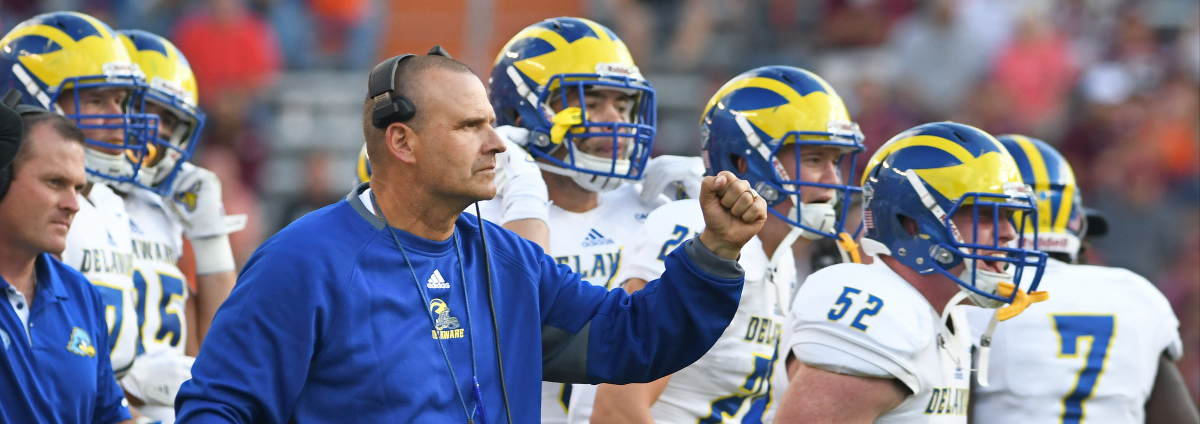
Delaware’s secondary has been one of the most dominant units in FCS this season. It only gave up 4.76 yards per attempt in the regular season (first in the nation) and allowed a completion percentage of just 47.5%. It also allowed only 11.6 points per game and ranked sixth in yards per play allowed. The defense continued its dominance in the first round of the playoffs, holding Sacred Heart to just 10 points on 3.6 yards per play.
Delaware’s offense won’t blow you away, but it still gets the job done. It’s top-20 in points per play and Touchdown Rate and scores over 30 points per game. It’s relatively balanced, ranking 16th in yards per pass attempt and 30th in yards per carry.
Looking at Jacksonville State, it’s coming off a 49-point blowout against Davidson last week. The offense averaged more than 10 yards per play and had 239 passing yards on just 15 attempts.
It runs the ball at one of the highest rates in the country, so Delaware’s elite secondary may not play as much of a factor here. The Gamecock offense has averaged 5.8 yards per play on the season, which was good for 22nd.
Similar to Delaware, the Gamecocks’ strength this season has been on defense. They rank in the top 15 in yards per play, points per play, and Touchdown Rate on the year. There really is no significant weakness on that side of the ball when looking at the numbers.
It might be tough to move the football on both sides.
»» Return to the Table of Contents ««
North Dakota vs. James Madison
 |
|
| North Dakota Odds | +3 |
| James Madison Odds | -3 |
| Moneyline | +125 / -150 |
| Over/Under | 52.5 |
| Time | TV | Sunday, 6 p.m. ET | ESPN2 |
| Odds via BetMGM. | Bet Now |
Click here to view offensive and defensive team stats for this matchup.
2021 FCS Spring Rankings
North Dakota (UND) Offense vs. James Madison (JMU) Defense
| Team Stat | UND Offense | JMU Defense | Advantage |
| Points per Game | 25 | 2 | JMU |
| Plays per Game | 36 | 1 | JMU |
| Yards per Play | 43 | 2 | JMU |
| Points per Play | 40 | 3 | JMU |
| First-Down Rate | 73 | 2 | JMU |
| Red-Zone Scoring Rate | 59 | 77 | UND |
| Pass Completion % | 42 | 6 | JMU |
| Yards per Pass | 61 | 4 | JMU |
| INT Rate | 44 | 32 | JMU |
| Yards per Rush | 5 | 3 | Draw |
| Havoc | 1 | 6 | Draw |
James Madison (JMU) Offense vs. North Dakota (UND) Defense
| Team Stat | JMU Offense | UND Defense | Advantage |
| Points per Game | 13 | 30 | JMU |
| Plays per Game | 30 | 35 | Draw |
| Yards per Play | 43 | 66 | JMU |
| Points per Play | 40 | 30 | UND |
| First-Down Rate | 84 | 62 | UND |
| Red-Zone Scoring Rate | 68 | 89 | JMU |
| Pass Completion % | 65 | 59 | Draw |
| Yards per Pass | 86 | 59 | UND |
| INT Rate | 51 | 25 | UND |
| Yards per Rush | 11 | 55 | JMU |
| Havoc | 55 | 74 | JMU |
![]()
![]()
![]()
Among all the teams left in the FCS playoffs, only Sam Houston State had a higher average point differential in the regular season than James Madison’s 24.
The defense has been dominant in all phases this year. The Dukes allowed only 9.8 points per game this season, and its 3.22 yards per play allowed ranked second in the nation. James Madison was the only team to rank in the top five in both yards per pass attempt allowed (fourth) and yards per carry allowed (third). They’ve been able to cause disruptions all year as well, with a top-five ranking in tackle for loss rate.
North Dakota got it done against a weak Missouri State team last week, but James Madison is a much different animal. I’m skeptical the Hawks will be able to consistently move the ball against this defense.
While they do have a top-five rushing attack in terms of yards per carry, the pass offense is below average at 58th in yards per attempt. They rank just outside the top 20 in most offensive efficiency metrics.
![]()
![]()
![]()
They have been great at limiting Havoc on offense, however. It will be interesting to see if JMU’s Havoc-minded defense can cause some turnovers against an offense that has been very good at keeping the ball clean.
James Madison looks to have a sizable advantage over the North Dakota defense. Just like the defense, the Dukes’ offense is very efficient in both aspects. Quarterback Cole Johnson ranks fifth in the country in yards per attempt, and running back Jawon Hamilton is 10th in yards per carry. Its ranking of 55th in Havoc allowed is the biggest weakness on offense.
The Dukes should be able to move the ball pretty successfully against a North Dakota defense that ranks below the national average in yards per play and Touchdown Rate. It’s not particularly strong against the run or pass, either. It allows 7.2 yards per pass (59th) and ranks only 56th in yards per carry.
Johnson should also have a pretty clean jersey at the end of the game against a pass rush that ranks 75th in Sack Rate. How I see it, James Madison -2.5 is my favorite bet of the weekend.
»» Return to the Table of Contents ««
Southern Illinois vs. South Dakota State
 |
|
| Southern Illinois Odds | +15.5 |
| South Dakota State Odds | -15.5 |
| Moneyline | +475 / -650 |
| Over/Under | 54.5 |
| Time | TV | Sunday, 9 p.m. ET | ESPN2 |
| Odds via BetMGM. | Bet Now |
Click here to view offensive and defensive team stats for this matchup.
2021 FCS Spring Rankings
Southern Illinois (SIU) Offense vs. South Dakota State (SDSU) Defense
| Team Stat | SIU Offense | SDSU Defense | Advantage |
| Points per Game | 32 | 9 | SDSU |
| Plays per Game | 31 | 18 | SDSU |
| Yards per Play | 10 | 18 | SIU |
| Points per Play | 86 | 11 | SDSU |
| First-Down Rate | 66 | 13 | SDSU |
| Red-Zone Scoring Rate | 67 | 18 | SDSU |
| Pass Completion % | 21 | 48 | SIU |
| Yards per Pass | 72 | 12 | SDSU |
| INT Rate | 36 | 4 | SDSU |
| Yards per Rush | 19 | 32 | SIU |
| Havoc | 30 | 60 | SIU |
South Dakota State (SDSU) Offense vs. Southern Illinois (SIU) Defense
| Team Stat | SDSU Offense | SIU Defense | Advantage |
| Points per Game | 22 | 71 | SDSU |
| Plays per Game | 75 | 23 | SIU |
| Yards per Play | 27 | 77 | SDSU |
| Points per Play | 56 | 75 | SDSU |
| First-Down Rate | 76 | 83 | Draw |
| Red-Zone Scoring Rate | 23 | 87 | SDSU |
| Pass Completion % | 50 | 49 | Draw |
| Yards per Pass | 94 | 64 | SIU |
| INT Rate | 65 | 82 | SDSU |
| Yards per Rush | 4 | 85 | SDSU |
| Havoc | 25 | 73 | SDSU |
![]()
![]()
![]()
The top-ranked team in the tournament did its best to justify that ranking with a 31-3 win in Round 1. I still don’t think this is the best team in the FCS, but it should coast to another win against the weakest remaining team in the tournament.
Southern Illinois is the only remaining team with a negative average point differential. The Salukis squeaked out a win over Weber State last week despite being outgained 6.3-5.6 in yards per play.
Southern Illinois has struggled on defense this year, and that showed up last week when it allowed 13.7 yards per pass attempt to Weber State. The Saluki defense ranks outside the top 75 in yards per play, points per play, yards per carry, and First Down Rate.
The pass defense is probably the strongest area on this defense, but it still allows more yards per pass than the national average. Can the Salukis at least create Havoc? Not even close. They’re seventh-worst in Havoc rate.
Southern Illinois’ offense has definitely been the strength of the team. It moves the ball efficiently and keeps it clean. It has a top-25 ranking pretty much everywhere: First Down Rate, yards per play, yards per attempt, completion percentage, yards per carry, and Havoc allowed.
It scores the second-fewest points per game among the remaining teams but still moves the ball effectively. It’ll probably need to score a healthy amount of points to have a chance in this one.
South Dakota State’s offense isn’t lighting the world on fire this year, but it should find plenty of success in this matchup. It ranked 12th in yards per play in the regular season, thanks in large part to its rushing attack. Its 5.68 yards per carry ranked fourth in the nation.
It has three players who have rushed the ball more than 60 times this year: running backs Pierre Strong and Isaiah Davis, and quarterback Mark Gronowski.
Davis ranks third in the country at 7.5 yards per carry. Strong, the leader in carries, ranks 22nd, and Gronowski has averaged 6.5. Southern Illinois’ 86th-ranked run defense could be in trouble here.
On defense, the Jackrabbits have largely gotten it done everywhere outside of generating Havoc. SDSU ranks only 83rd in that department but has been efficient pretty much everywhere else.
Its biggest weakness outside of Havoc is probably run defense, but it still ranks 32nd in yards per carry allowed. I’m expecting a comfortable win for the Jackrabbits yet again.
![]()
![]()
![]()
»» Return to the Table of Contents ««