Todd Kirkland/Icon Sportswire via Getty Images. Pictured: Azeez Ojulari.
What is a power rating in sports betting?
Well, it’s not all that different from trading stocks — you assign a value to something based on a number of factors, and try to buy it when it’s low, and sell when it’s high.
With stocks, long-term investors look for a clean balance sheet, revenue growth and market capitalization. In sports betting, a gambler should look for price point, market deflation and growth over peers.
For example, Vanderbilt would be a sell due to practice suspensions and one of the lowest returning production marks in college football. I’ll be betting against them if my projected spreads are higher sportsbooks are posting.
In this article, we’ll take a look at our new set of power ratings with the inclusion of active FBS and FCS members.
Simply subtract the lower team’s rating from the higher team’s to create a projected point spread on a neutral field.
How Do I Use These Power Ratings to Bet?
The numbers are designed to be basic for you, the bettor — just take the higher team’s number and subtract the lower team’s number. You’ve got a point spread.
I assign Clemson a 99.5, and North Carolina an 80. That means Clemson would be -19.5 on a neutral field. If an opening point spread was released on Clemson -17, I would likely look to get money down on the Tigers.
Conversely, if the point spread closed North Carolina +21, I would look to back the Tar Heels. Rarely do I ever go against my power ratings, as they are the best indicator to determine market inflation and public perception on a team. But I don’t bet every single discrepancy, either.
When a big discrepancy exists in the market between my Power Ratings and the oddsmaker’s point spread, I need to take a deeper dive to see if there’s something I’m missing, and if there are variables I may not be accounting for in a particular matchup (success rate, explosiveness, trench play, etc).
What Moves a Power Rating?
Earlier this year, I did a sports betting tutorial series examining the scope of power ratings. Conference strength, coaching changes and returning production each play a role during offseason evaluations, but the regular season requires a different approach: Advanced box scores become paramount to adjusting a team’s power rating.
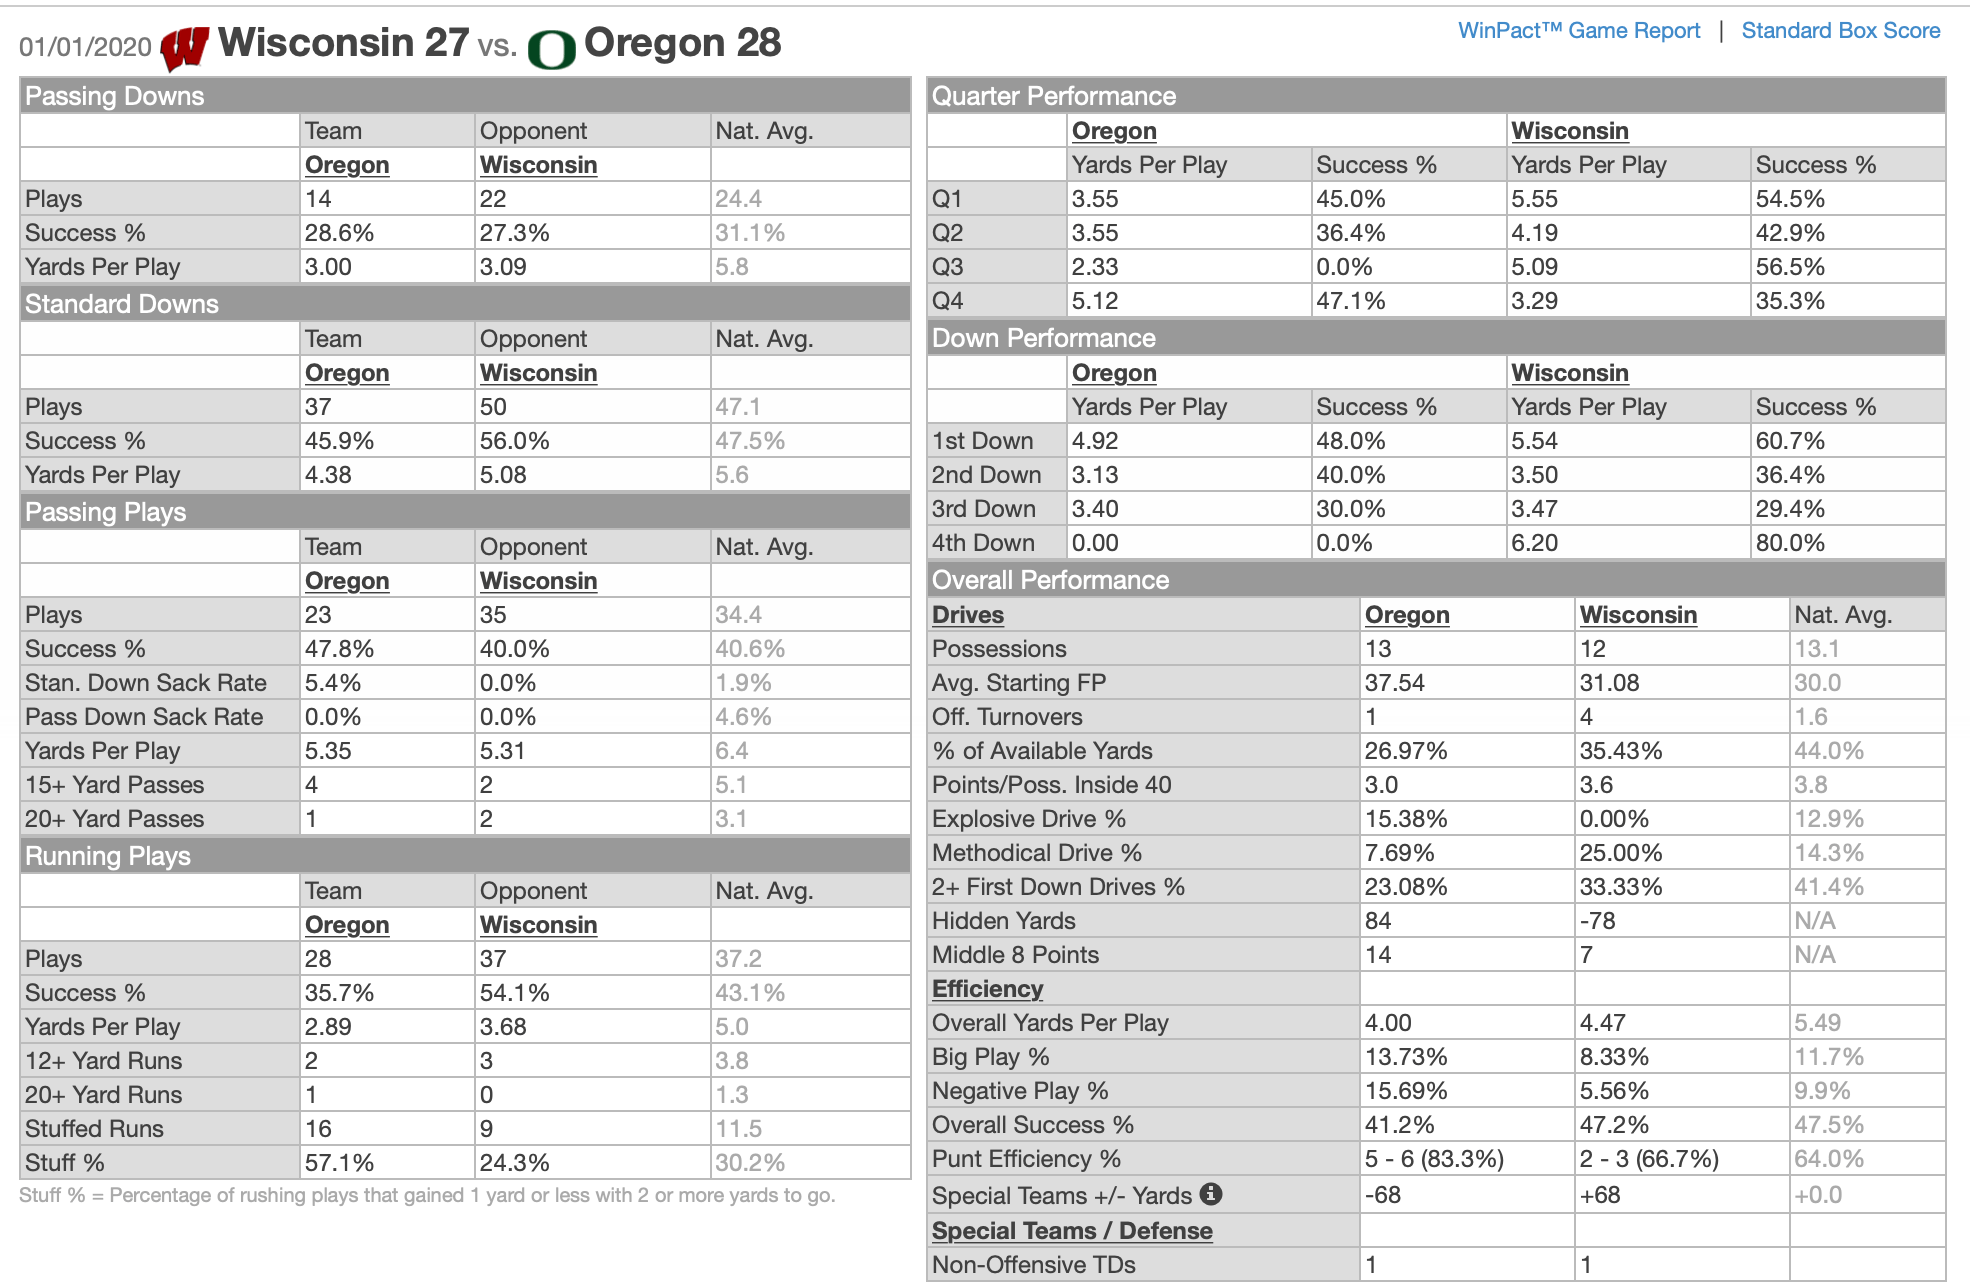
As an example, let’s look at the advanced box score for the 2020 Rose Bowl between Wisconsin and Oregon.

This was an excruciating game for my bankroll with plenty of volume down on Wisconsin as a pick ’em. The Badgers won this game all over the box score — from overall success rate to yardage to negative play percentage.
However, turnovers by the Badgers and explosive drives got Oregon to the window. Nonetheless, Wisconsin earned a positive power rating bump due to its better postgame win expectancy. Meanwhile, the Ducks were docked a point on their overall number.
Terms to Know
Postgame Win Expectancy is a calculation of all variables in a box score that dictate who would win the game if it was played a high number of times. Turnover luck, success rate and yards per play are notable components of this calculation, and can influence a single game. But over a large sample, the team that moved the ball better would win more often than not.
There have been plenty of box scores where a team wins as an underdog, but a negative value is applied to that team’s power rating, because the result was fluky rather than systematic.
Coach scheme changes can adjust a power rating quickly. For example, Oregon will undergo a change from Marcus Arroyo’s conservative play-calling to new offensive coordinator Joe Moorhead’s system. Moorhead’s offense features a heavy dose of 11 personnel, west coast spread concepts and modern RPOs.
That offensive philosophy has led to more explosiveness and higher rates of success on standard downs at each of Moorhead’s previous stops at Penn State and Mississippi State. In a situation like this, a power rating can be useful to quickly adjust a team’s forecast for future games. In the case of Mike Leach, an adjustment of totals is coming with an increase in plays per game.
Success Rate and Explosiveness were first defined in Bill Connelly’s Five Factors and are strong indicators for future box scores. While EPA (Expected Points Added) and IsoPPP (Isolated Points Per Play) can be highly variable from season to season, Success Rate is a stable data point for handicappers to use for projections.
Simply put, if a team consistently achieves the desired amount of yards — determined by down and distance — then this is a “play-on” team with your bankroll. Texas A&M ranked 17th in offensive success rate last season and returns 80% of its offensive production for 2020; that combination makes the Aggies a play-on team.
Be sure to bookmark our power ratings for the latest update on all FBS and FCS teams playing this fall.